Nepal to have 6.5 percent of economic growth during 2018/19 : IMF

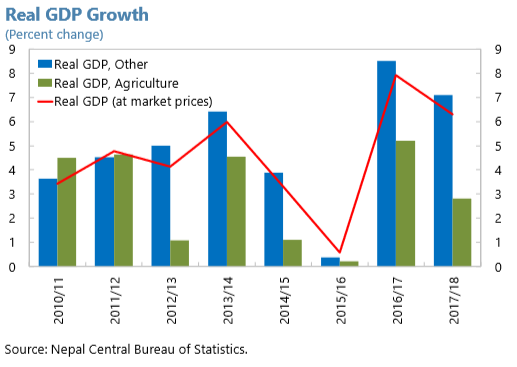
Gross domestic product (GDP)of Nepal is estimated to have expanded by 6.3 per cent in Fiscal Year (FY) 2017/18 (mid-July 2017 to mid-July 2018), and headline inflation has averaged 4.2 per cent, held down by subdued food-price inflation. The press release issued by International Monetary Fund (IMF) has highlighted that Nepal’s economy is enjoying a solid expansion, supported by ongoing reconstruction activity following the 2015 earthquakes and increased growth in manufacturing and tourism-related sectors.
The Executive Board of the IMF on February 8, concluded the Article IV consultation with Nepa. Under Article IV of the IMF’s Articles of Agreement, the IMF holds bilateral discussions with members, usually every year. A staff team visits the country, collects economic and financial information, and discusses with officials the country’s economic developments and policies. On return to headquarters, the staff prepares a report, which forms the basis for discussion by the Executive Board.
| Nepal: Selected Economic Indicators, 2015/16–2019/20 | |||||
| 2015/16 | 2016/17 | 2017/18 | 2018/19 | ||
| Est. | Projections | ||||
| Output and prices (annual percent change) | |||||
| Real GDP | 0.6 | 7.9 | 6.3 | 6.5 | 6.3 |
| Headline CPI (period average) | 9.9 | 4.5 | 4.2 | 4.9 | 6.5 |
| Headline CPI (end of period) | 10.4 | 2.7 | 4.6 | 5.1 | 6.5 |
| Fiscal Indicators (in per cent of GDP) | |||||
| Total revenue and grants | 23.3 | 24.4 | 25.5 | 29.2 | 29.4 |
| of which: tax revenue | 18.7 | 21 | 21.9 | 25.2 | 25.4 |
| Expenditure | 21.9 | 27.5 | 32 | 34.2 | 34.4 |
| Expenses | 16.5 | 19.6 | 23.1 | 26.8 | 27 |
| Net acquisition of nonfinancial assets | 5.5 | 7.9 | 8.9 | 7.4 | 7.4 |
| Operating balance | 6.8 | 4.8 | 2.4 | 2.4 | 2.4 |
| Net lending/borrowing | 1.4 | -3.1 | -6.5 | -5 | -5 |
| Statistical discrepancy | -0.9 | -1.3 | -3.1 | 0 | 0 |
| Net financial transactions | -2.3 | 1.8 | 3.5 | 5 | 5 |
| Net acquisition of financial assets | 4.7 | 1.4 | 2.6 | -0.1 | -0.1 |
| Net incurrence of liabilities | 2.4 | 3.2 | 6 | 4.9 | 4.9 |
| Foreign | 0.7 | 1.3 | 2.5 | 3.7 | 3.9 |
| Domestic | 1.7 | 1.9 | 3.6 | 1.2 | 1 |
| Money and credit (annual per cent change) | |||||
| Domestic credit | 17.4 | 20.2 | 26.1 | 21.3 | 18.1 |
| Private sector credit | 23.2 | 18 | 22.3 | 19.8 | 16.9 |
| Velocity | 1 | 1 | 1 | 0.9 | 1 |
| Saving and Investment (in per cent of nominal GDP) | |||||
| Gross investment | 33.9 | 45.7 | 51.8 | 55 | 57 |
| Gross fixed investment | 28.7 | 31.8 | 34.1 | 36.2 | 37.5 |
| Private | 23.3 | 23.9 | 25.2 | 28.8 | 30.1 |
| Central government | 5.5 | 7.9 | 8.9 | 7.4 | 7.4 |
| Change in stock | 5.2 | 13.9 | 17.7 | 18.7 | 19.4 |
| Gross national saving | 40.2 | 45.4 | 43.6 | 45.4 | 44.5 |
| Private | 33.2 | 41.8 | 42.4 | 44.1 | 43.3 |
| Central government | 7 | 3.6 | 1.2 | 1.2 | 1.2 |
| Balance of Payments | |||||
| Current account (in millions of U.S. dollars) | 1,339 | -93 | -2,350 | -2,778 | -4,129 |
| In per cent of GDP | 6.3 | -0.4 | -8.2 | -9.6 | -12.5 |
| Trade balance (in millions of U.S. dollars) | -6,389 | -8,446 | -10,849 | -12,899 | -15,061 |
| In per cent of GDP | -30.2 | -33.9 | -37.7 | -44.6 | -45.6 |
| Exports value growth (y/y per cent change) | -28.8 | 9.9 | 15.5 | 5.3 | 8 |
| Imports value growth (y/y per cent change) | -7.4 | 30 | 27.4 | 17.9 | 16.2 |
| Workers’ remittances (in millions of U.S. dollars) | 6,253 | 6,556 | 7,224 | 8,495 | 9,084 |
| In per cent of GDP | 29.5 | 26.4 | 25.1 | 29.4 | 27.5 |
| Gross official reserves (in millions of U.S. dollars) | 8,574 | 9,264 | 9,304 | 8,558 | 6,788 |
| Gross official reserves (in millions of U.S. dollars) | 8,574 | 9,264 | 9,304 | 8,558 | 6,788 |
| In months of prospective GNFS imports | 9.6 | 8.3 | 7.2 | 5.7 | 4.4 |
| Memorandum items | |||||
| Public debt (in per cent of GDP) | 27.9 | 26.4 | 30.4 | 33.1 | 34.1 |
| GDP at market prices (in billions of U.S. dollars) | 21.2 | 24.9 | 28.8 | 28.9 | 33 |
| Exchange rate (NPR/US$; period average) | 106.4 | 106.2 | 104.4 | … | … |
| Real effective exchange rate (average, y/y per cent change) | 6 | 3.3 | -0.1 | … | … |
Sources: Nepali authorities; and IMF staff estimates and projections. |
|||||
Likewise, the government expenditure has increased by 32.4 per cent (year-on-year) in FY 2017/18, propelled by Nepal’s transition to fiscal federalism and ongoing reconstruction spending. As in previous years, spending was concentrated in the last quarter of the fiscal year. Revenue growth was also substantial (18.9 per cent). Nevertheless, the fiscal deficit increased to 6.5 per cent of GDP, from 3.1 per cent of GDP in FY 2016/17.
Private sector credit has been expanding very rapidly in recent years, posting 24 per cent (y/y) growth in December 2018, following average growth rates above 20 per cent since FY 2015/16.
The current account has moved sharply into deficit position (8.2 per cent of GDP in FY 2017/18), following a modest deficit of 0.4 per cent in FY 2016/17. Imports grew by 27.4 per cent (y/y), following a 30 per cent expansion in FY 2016/17. Exports have also expanded, by 15.5 per cent, but this growth has applied to a low base (exports comprised 3.1 per cent of GDP in FY 2017/18). Nepal’s substantial trade deficit is partly financed by buoyant remittance inflows, which grew by 10.2 per cent (y/y) in FY 2017/18 and were equivalent to 25.1 per cent of Nepal’s GDP. As of December 2018, gross official foreign exchange reserves held by the Nepal Rastra Bank stood at US$ 8.3 billion, having declined by approximately US $1.2 billion from the record set in January 2018.


Facebook Comments